Visualizations


Auto generated pulsing spheres made up of 3D triangles.
Auto generated pulsing spheres made up of 3D triangles.


We developed an Android App, “BeatRush”, as our solution to the problem of Rush Hour.
The BeatRush App System has the following components:
The system uses the following input:

Algorithm
We use the A* algorithm along with backtracking, for searching the best path from source to destination. We want to find the path that takes the minimum time.
f(x) = g(x) + h(x), whereg(x) = distance(A,B)/TrafficSpeed(A,B) and the heuristic
h(x) = distance(B, GoalNode)/SpeedLimit
distance(A,B) = the great circle distance between point A and the neighbor point B,
TrafficSpeed(A,B) = speed of traffic between points A and B, obtained from Here Traffic API.
SpeedLimit is in kmph, and is obtained from the OSM database.
The great circle distance is the shortest distance between two points on the surface of a sphere.
It is given by the following formula:
where Φ1, 𝝺1 and Φ2, 𝝺2 are the latitude and longitude of points 1 and 2 and ΔΦ and Δ𝝺 are their absolute differences. Δ𝞼 is the central angle between them.

What if we could fight the terrible traffic we all have to encounter during rush hour? What if there was a better way to move and travel that can make our time more efficient?
Traffic is an issue that has been impacting society for a long time now. Rush hour is a part of the day during which traffic congestion on roads and crowding on public transport is at its highest. Rush hour is a phenomenon that usually happens twice a day – once in the morning and once in the evening, the times during which people commute the most. We propose a solution to the problem of Rush Hour by suggesting the most time-efficient route for the user to take between two locations.
Artificial intelligent agents in the direct control class usually focus on managing estimation of traffic in a particular road network for controlling traffic lights, analyzing the traffic demand for a particular route, and on qualitative predictions of route demands (rush hour) and bottlenecks that could form. On the other hand, the indirect control class agents usually focus on climate predictions and using the direct control agents information to alert the drivers.
Palmistry Ball is a maze palm reader that lives in your hand through projection mapping. In every level you will need to roll the ball into the white finger. Only one finger will be white every turn, while the others will control your four main hand lines: “heart”, “head”, “life”, and “fate”. These lines will act as walls in your quest to take the ball to the white finger. Succeed in taking it and proceed to the next level of your Palmistry reading. You need to be careful with your hand movements. If the ball falls off your hand, you will have to re start that level.
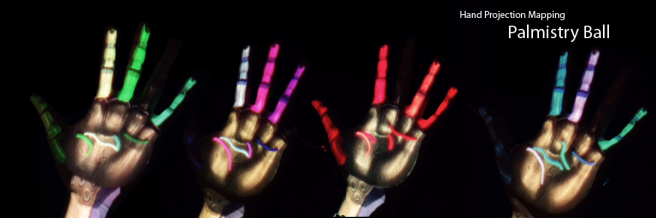
After the show I also did a second way of visualizing the game by removing the hand and just showing the white finger, the ball and the lines. After play-testing both types of visualization i learned that both are very interesting to play with and create a different experience.

I got inspired to do this project by Golan. He initially pitched me the idea of doing a game on the hand. After seen how cool projection mapping in the hand looked, I designed 3 different games and chose the best suitable for the project. I learned a lot about mapping. I have always wanted to do something with projection mapping but never had the chance. This project was perfect to get my hands into mapping and I realize how fun and the amount of possibilities it has in entertainment.
After finishing my initial capstone prototype I wasn’t to happy with it because even though it worked very nice, it was to boring for my taste. So i decided to spin it off into something crazier.
A game that will live in your hand through projection mapping.

Calibrating the hand has two main stages. Aggregating the right amount of points and then shifting the camera. To aggregate the points needed to successfully map your hand with the projector we need to save the 3D point of the leap motions index finger and the 2D point of where the mouse thinks that index finger is. In the image bellow you can see the calibration process.

This image shows what happens when you don’t aggregate the points correctly. The image will be offset from your hand.

In contrast, this images show how it looks in OF when you have successfully calibrated the hand projections.


Live App: http://womenstennis.fusion-sky.com/
I am a big tennis fan and decided to see if the tweets a player gets in a game reflects in the persons performance. In other words, I wanted to see if the fans were tweeting players hopes up (or down) and predicting the outcome. many interesting patterns were found, which made me very happy! 🙂
I initially tried to use Tamboo but couldn’t use it because Twitter API only allows you to get tweets that are 30 days old. Given that the USOPEN had been a couple of months back I did a parser to parse “Topsy”. After finishing my parser, I had to parse the data multiple times to get all (or almost all) the tweets one player got during the day of her game. It took a long time…
After aggregating the data, I cleaned it up using some text analysis libraries. (Total around ~15,000 tweets) Once everything was done, or as done as it was going to get thanks to lack of time, I started visualizing it.
I decided to use webGL and Three.JS because I really wanted to learn it.
I made a bracket time visualization with the winners in the right in shades of green, and the losers to the left in shades of red. The size of the circle represents the amount of tweets that player got in that game. If you hover over the player you get to see more information. The orange circle represents the amount of positive tweets and the purple the amount of negative tweets. The rest are neutral. Apart from the extra information; all the games of that player glow up for the user to see the success of that player.
You can still navigate the interactive visualization with the arrow keys and the mouse (zoom, etc.)
Magic Mirror:
Try your outfit without having to change your cloth and share it with others for feedback!
My capstone proposal consists on creating a magic mirror that will help the user try their favorite cloth in different colors in real time. This way, you can see what shirt or sweater looks better on you. The player will also be able to “grab” the image in the mirror and “put” it in their phone to share it with friends. The world is reactive if we let it be magical.
Mobile phones bring computing power to immobile objects. With this in mind, I decided to incorporate our phones in the experience to bring the mirror even more alive. I got inspired on the video below and really wanted to do something similar. From here I got the idea of grabbing the image in the mirror and “put” it on the phone to share it with others:
Research:
There are some people also trying to bring mirrors to live. For example Neiman Marcus’ Digital Mirror record what you currently are wearing for later to compare it with a new outfit. Another example is Rebecca Minkoff First Interactive Store. Users can select their cloths in a giant touchscreen mirror. Then the cloth will be taken to a fitting room and when it is ready the user will get a text message. Inside the fitting room the user has access again to the touchscreen mirror. Here they can ask for other sizes etc. and share their findings through social network.
Even though these two ideas are very good, I wanted to bring a more magical experience to live. Magic mirror will use these two examples as case studies and expand on what works and what doesn’t. It will be real-time, and it will allow the user to share it with others through the phone gesture.
The project will be broken into 4 main stages:
References:
https://www.youtube.com/watch?v=eYveEdhTgBs
http://www.digitalsignagetoday.com/videos/rebecca-minkoff-debuts-first-interactive-store/
http://www.engadget.com/2015/01/13/neiman-marcus-memory-mirror/
Writings from another Galaxy
My Love Star
Examples from the book
Inspiration by Application
EL MENSAJE SOMOS TODOS
Parsons MFA Design & Technology
